
AT A GLANCE:
• Risk premiums are narrowing as equities and Treasury yields both rise.
• Shrinking or negative S&P 500 equity risk premium can have meaningful implications for near- to medium-term asset allocation.
The risk premium investors demand for taking positions in equities and credit markets compared to a safe-haven asset like U.S. Treasuries has narrowed sharply, with 10-year Treasuries yielding 4.25% as of early July, raising their competitiveness with stocks and credit markets.
Equity and credit risk premiums typically measure their returns against 10-year Treasury notes, which have remained steady as the Federal Reserve (Fed) paused its monetary easing after cutting rates in December 2024 amid sticky inflation. Equities, on the other hand, have been surging since late 2022, narrowing the equity risk premium (ERP) with Treasuries. While there are various tenors of U.S. government fixed income securities that could be used as the risk-free rate, we focus solely on the 10-year Treasury note given its liquidity and common use as the singular risk-free rate.
The size and direction of the risk premium signify secular shifts in capital markets returns and asset-allocation decisions. The S&P 500 ERP is at a five-year low, and Investment Grade and High Yield credit risk premiums are steadily declining from their highs in the summer of 2023. Market participants can use CME Group equity and credit futures to manage their exposure to changing risk premiums.


Equity Risk Premium is Negative
Since early 2024, as U.S. equity markets rallied to new highs and bond yields reached attractive levels, investors have been pondering whether the shrinking ERP should be a cause for concern.
Equity risk premium varies through time depending on market conditions, even dipping into negative territory at times. Historically, negative equity risk premium has been accompanied by market corrections.
The correction scenario appears to be playing out in the equity markets. Year-to-date, the major U.S. equity indices are barely positive. For the first time since August 2002, ERP turned negative in March 2024, signaling that equity valuations are stretched, and stocks may be overvalued. Furthermore, the negative ERP brings up the question of whether market participants should meaningfully shift away from their equity allocations and move into safe-haven assets.
Shrinking or negative S&P 500 ERP can have meaningful implications for near- to medium-term asset allocation, with investors recalibrating returns expectations, and positive returns from U.S. equities are facing headwinds.
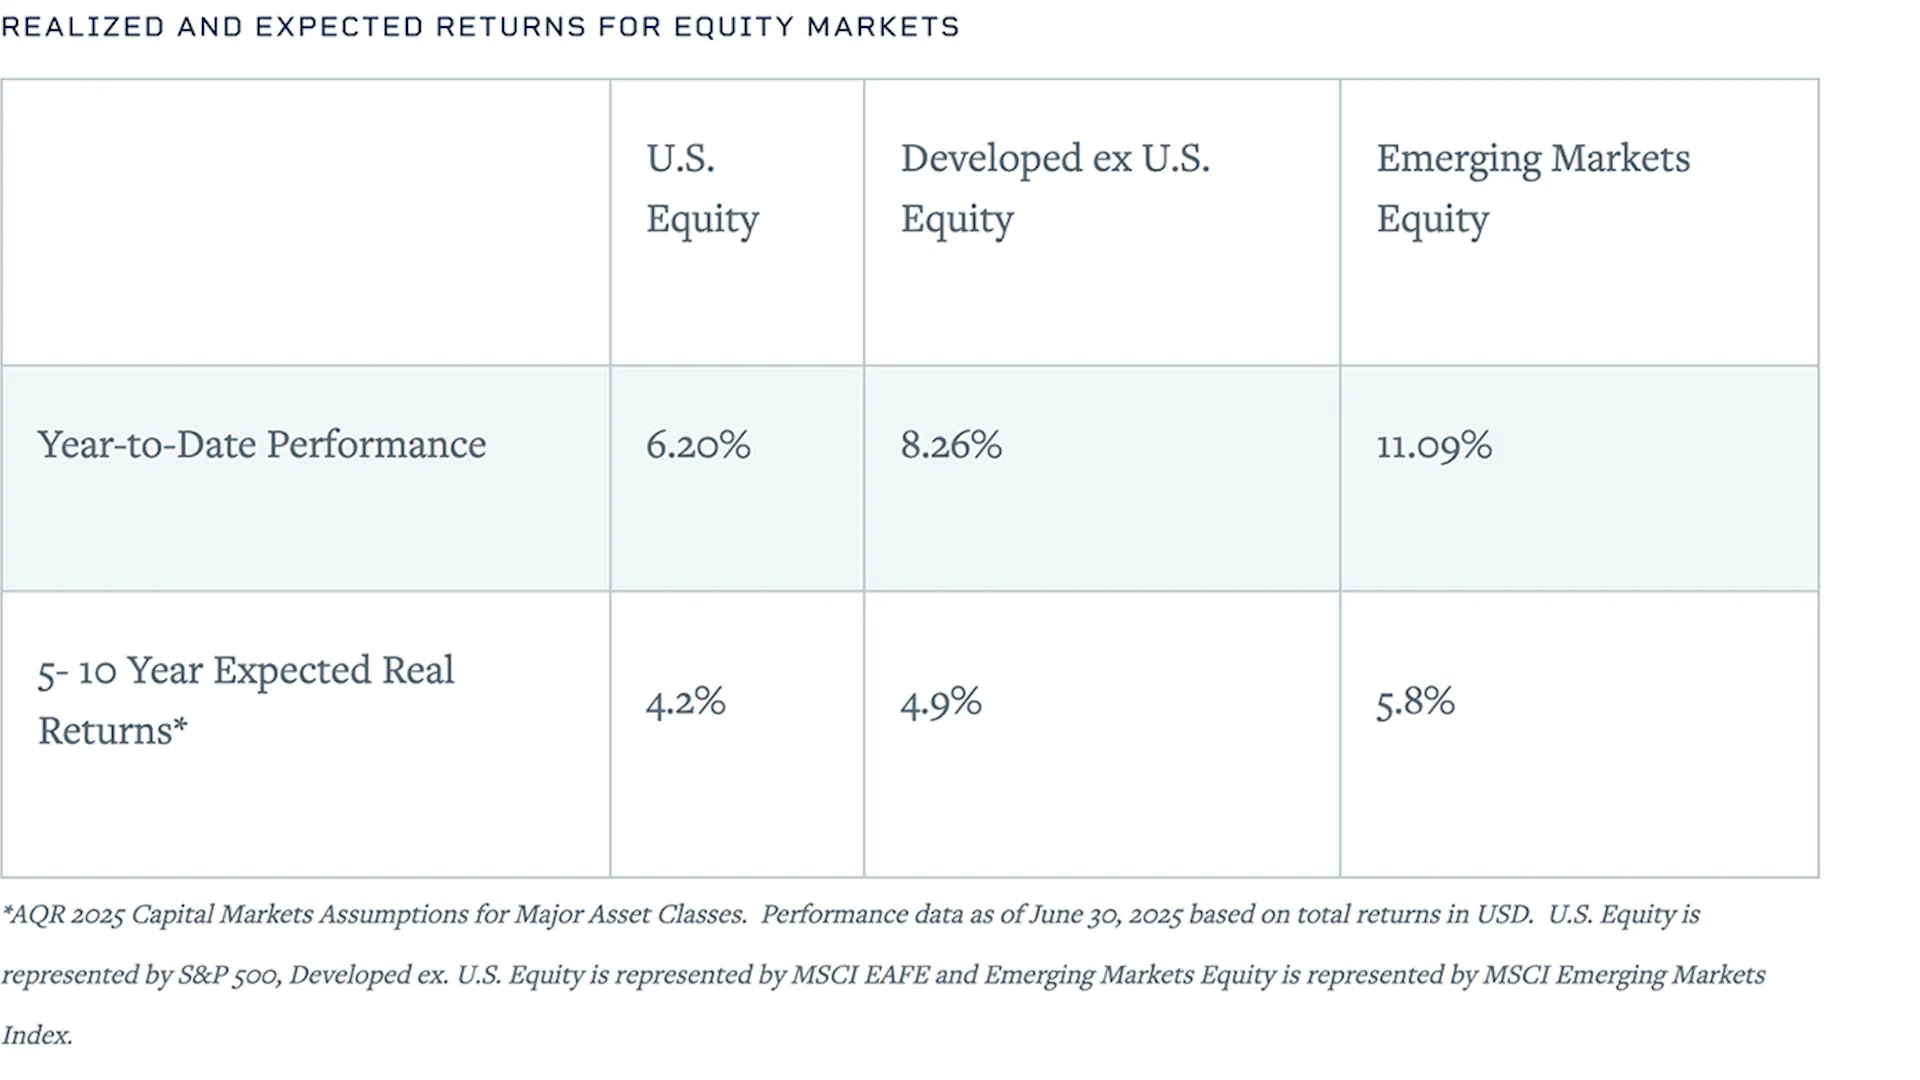
The shift is already underway in 2025 with both developed and emerging markets equities outperforming U.S. equities. With forecasts of five-year future returns from those markets being higher than those of U.S. equities, the implications are that the dominance of U.S. equity may be coming to a close. In that light, a degree of repositioning of portfolios away from U.S. stocks is taking place, with outflows from U.S. equity funds ($17 billion) and inflows into international equity funds ($7 billion) in May 2025.
It is still too early to tell whether this change in fund flows is transitory or long-lasting. History shows that the payoff from harvesting ERP is positive and stocks still earn excess returns over cash when held for a longer duration. Using the returns of the S&P U.S. Equity Risk Premium Index, it appears that going long E-mini S&P 500 futures and shorting U.S. Treasury bonds futures could result in a positive premium over the long-term investment horizon.

Credit Risk Premium is Declining
While not negative like the equity risk premium, the Option-Adjusted Spread (calculated as yield to worst less 10-year U.S. Treasury yield) for the Bloomberg U.S. Corporate Investment Grade Index and the Bloomberg U.S. Corporate High Yield Very Liquid Index ended May 2025 at 0.814% and 2.959%, respectively. This is down from their 5-year month end averages of 1.155% and 3.814%, respectively.
This tightening of credit spreads has occurred alongside an increase in the 10-year U.S. Treasury note yield. This suggests that the macroeconomic factors contributing to increasing rates – such as higher for longer interest rates, persistent inflation and uncertain trade policy – are not having a relatively large effect on the credit component of the risk premium calculation. In other words, investors are not requiring credit portfolios to have a higher-than-normal spread above Treasuries in order to hold credit – in fact the spread is lower than normal.

There are several potential explanations for tighter spreads:
- Relatively low credit yields may suggest that the market believes issuers are in strong fiscal positions despite macroeconomic uncertainty.
- The demand for meaningful yields may be highly robust and unlikely to waver soon, especially following the unusually long low interest rate environment following the 2008-09 financial crisis. This demand keeps credit yields low on a relative basis to Treasuries.
- The large supply of Treasury debt relative to corporate debt may be driving weak demand for Treasury debt. As the chart below shows, U.S. Treasury debt outstanding has increased by over $4 trillion since the first quarter of 2023; in contrast, U.S. corporate debt outstanding has increased by only $0.8 trillion. This represents a 17% increase in U.S. Treasury debt and only a 7% increase in U.S. Corporate debt.

Managing Equity and Credit Risk
CME Group offers both equity and credit index futures that help market participants manage asset class risk, implement risk premium driven portfolio repositionings and shift allocations. S&P 500 Index futures offer highly liquid and efficient exposure on the most tracked equity indexes in the world, and Bloomberg Credit futures offer exposure to the investment grade and high yield U.S. corporate bond market.
Margin offsets between equity and credit/rates products are significant – for credit and S&P 500 futures, the credit offset ranges from 32% to 50% – and offer market participants efficient access to these asset classes. As market conditions continue to evolve, risk management tools will likely remain an important consideration for many market participants.
CME Group futures are not suitable for all investors and involve the risk of loss. Full disclaimer. Copyright © 2025 CME Group Inc.
