
AT A GLANCE:
- Market participants are increasingly using short-term instruments alongside traditional “once-a-month expiry” option contracts.
- A positive correlation between event-driven market volatility and commodity weekly options usage has emerged.
For the fifth consecutive year, trading activity in short-dated commodity options has set a new record. In 2025, the total average daily volume (ADV) for weekly options reached 79,221 contracts, a 17% increase over the previous record set in 2024.

Since volume has more than quadrupled since 2020, this sustained growth trajectory suggests that the adoption of weekly options is not merely a cyclical trend but a structural shift in the way participants trade commodity options. Driven by an environment characterized by heightened geopolitical instability and short-term volatility, traders and hedgers are seeking the precision of short-term instruments to complement traditional “once-a-month expiry” option contracts.
The Macro Shift: Precision Over Duration
The primary driver behind this shift is the need for granular exposure. In a period defined by rapid news cycles, the longer duration associated with monthly expiry schedules often needs to be complemented by managing event-specific risks. Weekly options, with expiries falling on each weekday from Monday through Friday, allow participants to isolate specific windows of volatility, such as central bank announcements or geopolitical developments, without incurring the time-value premium of longer dated contracts.
Three prominent market scenarios across the commodity landscape highlight this shift:
1. Geopolitical Risks and Crude Oil
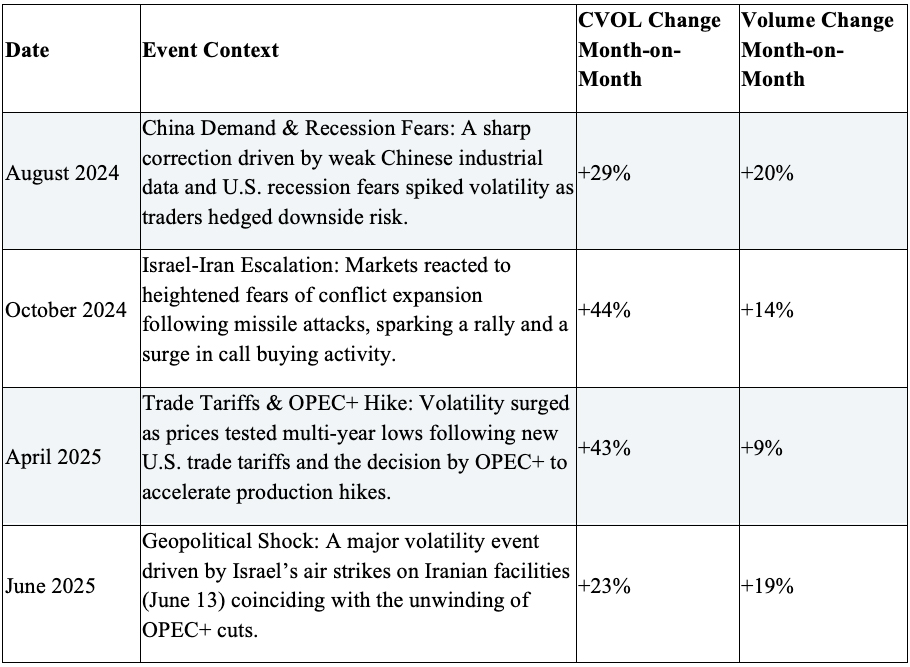
Over the last two years, the crude oil market has navigated a complex landscape of geopolitical shocks and shifting supply dynamics. A comparison of the month-over-month percentage change in the CME Group CVOL Index (a measure of 30-day implied volatility) against the month-over-month percentage change in total Weekly WTI options volume shows a robust and statistically significant positive correlation over this period.
This strong relationship indicates that traders are notably more active in weekly options when volatility is on the move and suggests that short-dated options have become a valid mechanism for the market to express views and hedge risk during volatile environments, validating their utility as a responsive tool for managing near-term price instability.
To illustrate this relationship in practice, the table below highlights four distinct periods where sharp increases in the CVOL Index coincided with increases in weekly options trading activity:

More recently, this pattern has continued. On March 11, WTI CVOL reached its highest level since 2022 as the conflict in Iran impacted the Strait of Hormuz, a vital chokepoint in the international energy trade. Simultaneously, trading activity in WTI weekly options jumped to record high levels, with more than 70,000 contracts traded on March 5th, 6th, 9th and 10th, respectively (versus a 2025 ADV of around 23,000 contracts).
2. Gold’s Path to Record Highs
Since 2016, the value of gold increased fivefold from just over $1,000/troy ounce to above $5,000 in early March. On that path, the market went through periods of heightened volatility intermixed with calmer regimes.
An analysis of the statistical relationship between price instability (measured in absolute percent differences in prices of the active contract from one month to the next) and activity in weekly options reveals a statistically significant positive correlation. It suggests that traders are more active in weekly options when the gold price is volatile. While the correlation is moderate, the signal is robust and illustrates how the market uses short-dated, weekly options during volatile market environments.

3. The “Tariff Trade” in Agriculture
On April 4, 2025, stemming from “Liberation Day” two days prior, China launched a 34% retaliatory tariff, and soybean futures prices plunged over 33 cents that day. As the world’s largest importer, China’s move threatened the primary outlet for U.S. exports, especially as the U.S. struggled to maintain its competitive edge against Brazil.
Market losses were quickly erased by a 90-day tariff reprieve for non-retaliating nations and rising biofuel demand in Brazil, which tightened global supply. This rally was solidified by a USDA report that showed lower U.S. soybean stocks and record domestic crushing demand, proving that internal consumption could help offset international trade volatility.
To reflect the needs of the industry to hedge shorter term risk with precision strategies and complement the preexisting suite of Friday weekly options, weekly options on grain and oilseed futures expiring each Monday through Thursday were launched in February of 2025. These products allow market participants to hedge risk or express a view on agricultural news released throughout the week, from scheduled USDA reports to spur-of-the moment political headlines.
Looking at activity in Soybean weekly options, April 4, 2025, was the second busiest day in the quarter, only bested by June 30, 2025—the day in which the annual USDA Acreage was published.
Looking Ahead
The fifth consecutive year of record-breaking volumes of 2025 suggests that short-dated options have transitioned from a tactical alternative to a practical necessity for many market participants. As the “Tariff Trade” and recent energy shocks illustrate, traditional monthly expiries may provide more duration than is required to manage risks concentrated around specific, short-term events. By allowing for the isolation of these volatility windows, weekly options offer a way to manage exposure without the overhead of the full-time value premium found in longer dated contracts.
This shift reflects an increasing preference for “just-in-time” risk management. Rather than maintaining a constant, broad-based hedge, many in the market are opting for the flexibility to deploy capital with day-of-the-week precision. Ultimately, the growth of these instruments points to a more modular approach to risk—one where the duration of a hedge can be more closely aligned with the actual life cycle of the market news that drives it.
CME Group futures are not suitable for all investors and involve the risk of loss. Full disclaimer. Copyright © 2026 CME Group Inc.
